It’s a frustrating position to find yourself in, but with the help of these cart abandonment stats, you’ll uncover some of the ways you can correct the common issues for eCommerce retailers and understand why your customer fails to complete their purchase.
General Shopping Cart Abandonment Rates, Trends, Facts, and Statistics 2023
Global Average Shopping Cart Abandonment Stats
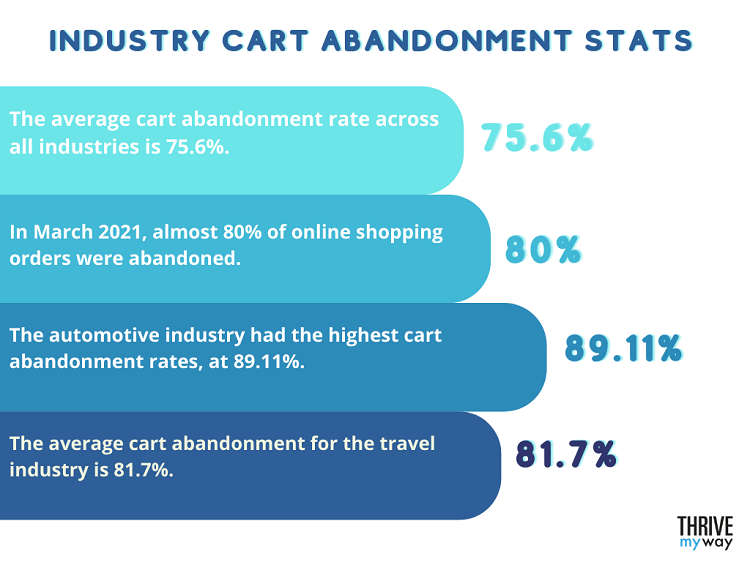
Industry Cart Abandonment Stats 2023
Average Shopping Cart Abandonment Rate by Device
Abandoned Cart Recovery Email Statistics
Average Conversion Rate for Cart Abandonment Statistics
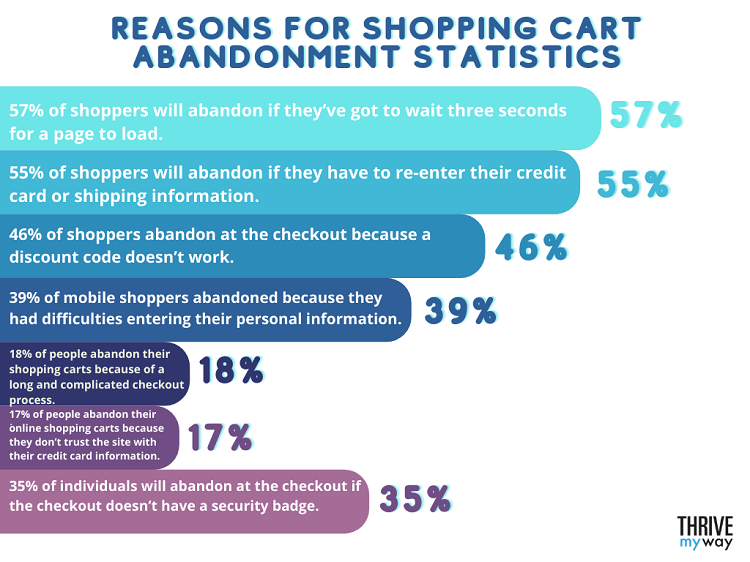
Reasons for Shopping Cart Abandonment Statistics
Ecommerce Shopping Cart Abandonment Effects Statistics
Solutions to Abandoned Cart Statistics
Abandoned Cart Recovery Statistics
Conclusion
Average shopping cart abandonment rates are at an all-time high. However, there are strategies you can adopt and improvements you can make that will encourage more customers to go through with their online orders. The most notable improvement for a potential customer is in the checkout design and checkout flow. The main aim is to improve the user-friendliness of your eCommerce platform and reduce the number of cart abandoners. An improved shopping experience will do wonders for your conversion rates. These cart abandonment statistics were compiled with the help of the following resources:
Sleeknote Statista Shopify Baymard Salecycle Moosend Barilliance TechJury 99Firms
About